
Introduction
Web Application Performance Analytics should be defined as the science of analyzing application responsiveness to identify observations, recommendations, and draw conclusions on component usage, analysis, interactions, and settings.
At some point proceeding through performance test analysis, the key performance indicators (KPI) should help with assessing the performance status. There should always be some observations that are noteworthy. Some of the observations may later become useful recommendations which lead to some performance tuning actions. The actions may require another round of tests to confirm results indicate performance improvements. If improvements are not as expected, more analysis may be required. It is expected that further testing results enable the ability to draw conclusions that confirm the target application is determined to be responsive, reliable, and stable operating within expected tolerances. In summary, performance status can be reported in terms of observations, recommendations, and conclusions.
Performance Analytic Tools can be categorized as descriptive, diagnostic, predictive, and prescriptive.
- Descriptive – tools that illustrate performance indicators graphically.
- Diagnostic – tools that analytically pinpoint performance indicators visually.
- Predictive – tools that project or foretell performance indicator trends.
- Prescriptive – tools that are dogmatic about specifying performance indicator range in terms of good, acceptable, and bad.
Chart 1
Category | Tool | Short Description |
Descriptive, Prescriptive | LoadRunner, JMeter, Rational, BlazeMeter | Test Scenario generate, execute, and analyze application performance |
Descriptive, Diagnostic, Predictive | New Relic, AppDynamics, Dynatrace, Prometheus | Application Performance Monitors – APM tools used to measure KPI’s for servers and network traffic |
Descriptive, Diagnostic | Fiddler, HAR, Chrome Developer tools | Browser tool for monitoring HTTP traffic. A tool primarily used for identifying performance issues, such as bottlenecks and slow load times, and page rendering problems. |
Descriptive, Diagnostic | Perfmon, Logman | A tool that is used to examine how programs running on computers or servers affect the performance. |
Diagnostic | Riverbed, Datadog | Network monitoring tools continuously monitor a network for problems such as slow or failing components (caused by overloaded and/or crashed servers, network connections or other devices), and will alert the network administrator in case of severe slowdowns or outages. |
Diagnostic | Oracle Diagnostics Pack, Oracle Tuning Pack, and Oracle Enterprise Manager | Oracle Database makes it easy to monitor the health and performance of your database. It monitors the vital signs (or metrics) related to database health and performance, analyzes the workload running against the database, and automatically identifies any issues that need your attention as an administrator. |
Diagnostic, Prescriptive | SQL Server DB Engine Tuning, System Monitor, Performance Dashboard | Microsoft SQL Server provides a comprehensive set of tools for monitoring events in SQL Server and for tuning the physical database design. The choice of tool depends on the type of monitoring or tuning to be done and the particular events to be monitored. |
Diagnostic | LogicMonitor Techmint tools for Linux | MySQL DB monitor and tuner |
Bottleneck Analysis
The diagram (Figure 1) is intended to help visually describe a breakdown of addressing potential bottlenecks. I felt a need years ago to identify and be able to communicate where potential problems or bottlenecks can be found. I came up with four major categories of analysis. And I divided the potential bottlenecks into five areas to assist with clarifying the scope. The five areas of potential bottlenecks shown in the diagram (blue squares) may not all be considered if the target application does not include, as for instance, database services. Some thought process is necessary to be certain of the potential bottlenecks. Once the bottleneck areas are clarified, then some analysis will be useful to what bottlenecks need resolution. The analysis categories are:
- Initiation & Rendering Analysis – to cover Client and Network activities degrading performance
- Load Analysis – to cover Client, Network, and Web Server activities degrading performance
- Data Analysis – to cover Web Services, Application Services, and Database services activities
- Traffic and DB Analysis – to cover Application and Database Services activities
The bottleneck analysis activities provide a means to eliminate early what service areas are not degrading overall performance. For instance, Network engineers take a strong stand with the network because they spend significant time testing network performance and tuning. So, it is likely that the network is not a potential bottleneck area. But when service areas are not all in the same physical location, there is cause for keeping network traffic analysis on the table.
Figure 1
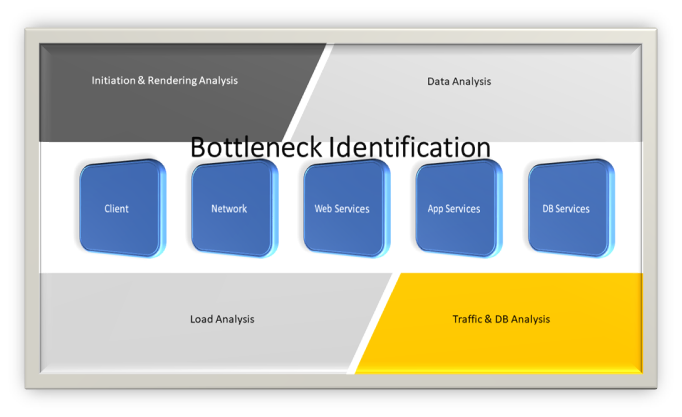
To recap, there are five areas of potential bottlenecks. These areas are:
- the client machine,
- the network between the client and the application web tier,
- the web servers, middleware, and load balance services,
- the application servers, application software, and load balance services,
- and the database servers along with its DB services.
There are four categories of analysis:
- Initiation & Rendering Analysis – the scope is Client and Network activities
- Load Analysis – the scope is Client, Network, and Web Server activities
- Data Analysis – the scope is Web Services, Application Services, and Database services activities
- Traffic and DB Analysis – the scope is Application and Database Services activities
I would like to separate this topic into multiple blog entries. The breakdown follows:
- WAP Analytics – Bottleneck Identification
- WAP Analytics – Bottleneck Analysis
- Applying WAP Analysis to a Sample Application