
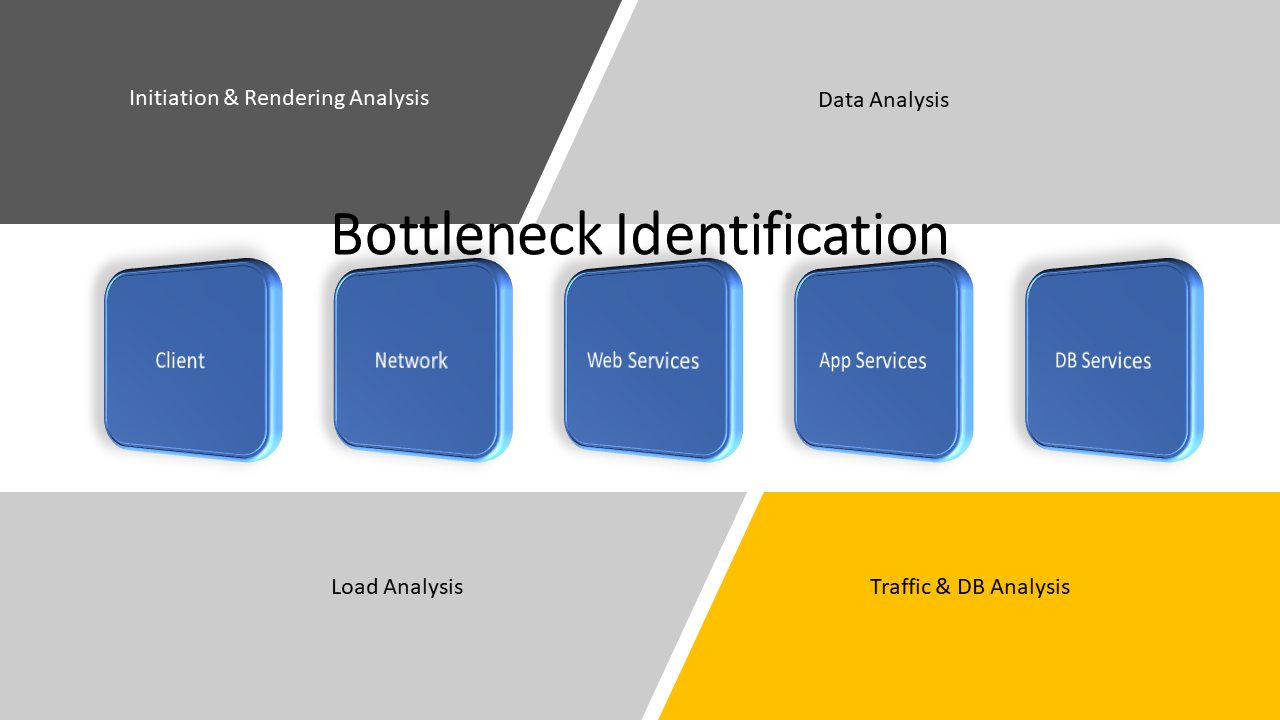
This article is an extension to my Web Application Performance Analytics (WAP Analytics) article. Here I will focus on the job of identifying bottlenecks in a web application. In general, there are five areas of potential bottlenecks that can exist in a web application under test. These areas are:
- the client machine,
- the network between the client and the application web tier,
- the web servers, middleware, and load balance services,
- the application servers, application software, and load balance services,
- and the database servers along with its DB services.
The diagram labelled figure 1, is intended to assist with visualizing the flow of bottleneck areas and their relation to analytical approaches. This writing will deal with the potential bottlenecks and identifying them for a performance test project.
Figure 1
Bottleneck Scope Identification
When I think about potential bottlenecks, it is my expectation that every performance test project does not have the same scope. The thinking is about “potential”. Therefore, I may be able to eliminate one or more bottleneck areas or at least part of an area. For instance, one of the first things I look at is Network. I know that the bottleneck areas start with the Client machine, but in terms of what might be eliminated the Network is a strong possibility. When you are gathering performance test requirements this is a good time to determine what scope of potential bottlenecks to include in the test scope.
Network Bottleneck Area
I have mentioned this before. My experience with Network Engineers always reminds me that most network engineering teams do what they are hired to do. They conduct tests, use Application Performance Monitoring tools, use diagnostic devices, and tune as much as possible to minimize network bottlenecks. The network data traffic can be impacted by bandwidth insufficiencies, latency issues, and packet loss challenges. Data transmission needs to be able to reach destination points in milliseconds. It cannot afford delays that cause minutes to go by. I can use the network traceroute command or tracert command to get diagnostics between network devices. The command is used to show several details about the path that a packet takes from the computer or device you’re on to whatever destination you specify. The result is measurement in milliseconds and number of hops.
Because network throughput is so important, it is necessary for network engineers to be on top of their game. We who are preparing to conduct application-level performance testing must consider network as an area that gets a green light. There are exceptions but the initial line of thought should be to “go to yellow alert” only if some remote users are already expressing the need for response time improvements at their location.
I like to reach out to network engineers initially to have them monitor during schedule performance tests to let us know if they find any anomalies. That way they are not on the defense but engaged to help with confirming the network is not a bottleneck.
Figure 2

I would use something like figure 2 to depict bottleneck conditions to proceed through testing activities. As you might proceed through a performance test project, this visual could be used in reporting to identify bottleneck status with:
- Red to indicate high potential for bottlenecks or bottlenecks discovered.
- Yellow to indicate moderate potential but no showstoppers.
- Green to indicate that all is clear. No bottlenecks discovered or expected.
So, if there is agreement resulting from requirements gathering that the network is out-of-scope, then we can start with figure 2 indicating Network is in the green state.
Client Bottleneck Area
Multi-tiered applications such as Client/Server web applications depend on the application screen rendering time to be reasonable. On average 5 seconds is reasonable. Whether the application uses a generic browser or a thin/fat client program, screen rendering time equates to response time for an end user. From the time they press the enter key until a response is returned is a measurement of response time for end users. The browser and some client programs have diagnostic tools built in. And the client machine operating systems are designed with diagnostic tools that assist with reporting client machine performance. Depending on the operating system or browser, the tools differ. But the environment does not lack in tools that can diagnose process performance.
Just as an example in the Windows environment, a browser provides developer tools that can monitor and report results that gives response status and execution status. Built into the operating system are performance monitoring tools that report on numerous KPI’s, such as, memory consumption, CPU utilization, and I/O activity.
Tuning requirements may involve company-wide mandates to upgrade hardware or software, or both. Hardware upgrades may include upgrading machine memory chips, hard drives, NIC cards, or even the device. Software upgrades may require changes to browsers, and other client machine services.
The key to knowing if there are client machine bottlenecks is this. What part of the application response time is the time devoted to browser or application client execution? Once that is known and it is significant, then the client button should reflect yellow or red alert. Of course, if the application screen rendering time is considered within SLA expectations, then the client button goes to green.
Web Bottleneck Area
When it comes to website and web services, the environment can be simple and straightforward like Apache/Tomcat, or it can be as complex as MS IIS or WebSphere. These environments operate with front-end and back-end services. The most important front-end service is authorization and authentication. The software spends time determining whether a user has permission to connect with the application and if that user is verified to have acceptable credentials. Without trying to teach a lesson on all that web and web services support, let’s just say that the more services active the more time to application and ultimate user response.
The number of potential concurrent user traffic coming over the network can be a potential bottleneck issue. The web authentication and authorization technology must be able to handle the traffic in receiving, processing, and responding. Otherwise, there may also be load balancing hardware and software inserted to control the web request traffic and route the traffic using some distribution algorithm.
Of course, there is the back-end processing that takes place to distribute accepted request traffic on to that application. And to manage and route the application packets to the awaiting end user.
Any of these processing points can become a bottleneck because there are wait queues and threads that may require tuning to adjust the throughput buffering and speed. In other words, long queues affect performance.
Overall treatment of back-end services must consider several concepts like:
- How many HTTP requests it takes to accomplish a business task and how many packets must be sent to the application and from the application?
- Are you using the latest HTTP-related technology?
- When images, CSS, JS, and other file are downloaded to a client machine to complete an HTTP request, are the file sizes optimum?
- Both latency and the required bandwidth time are reduced when the overall amount of data transmitted is reduced. Making use of CDN technology can help because it delivers dynamic location-based content especially for mobile apps, reducing load times, and increasing overall responsiveness.
- How much time it takes a browser to connect with a target server and start downloading a web page’s contents?
- Are compression services in use, such as, GZIP?
- Are caching services in use for the application website, associated browsers and servers?
- Using asynchronous scripts, such as, JavaScript means that your page can render in less time.
I am certain that there are other concepts to consider. Web technology continues to change and enhance. Sometimes applications are designed to use the latest and greatest technologies. This can happen without considering impacts. Therefore, it is important to review the web events and minimize performance conflicts.
Application Bottleneck Area
The application area can also be a simple structure of hardware and software processing, or a complex suite of technology involving front-end and back-end functionality. The core of the business application is here to manage input, queries, and change requests. All of which should respond to an end user’s request in a reasonable timeframe.
Today’s applications include command process responses, automated user notifications, validation processing with multiple rounds of response and inquiries, and background reporting based on both solicited and unsolicited requests. This can introduce the need for new KPI’s beyond the normal CPU, throughput, response time, queue time, error count, and memory consumption.
Jack Welch, former CEO of General Electric, was quoted with saying, “if it isn’t measurable, it isn’t manageable.” That fits in the application performance industry. We cannot manage the things we cannot measure. As application technologies change what needs measuring changes with it. Application support teams need insights into what the code is doing behind the scenes and how it’s affecting processing and response performance.
End users interact with multiple tiers of features that get developed over time. It’s essential to measure not only the high-level performance metrics, but also to drill down to the lines of code causing slow processing for either a single request or back-end job request.
How applications handle error conditions is important. Applications can be designed to report all requests, unexpected requests, or incomplete requests with log entries. That can be too many entries to a file whose I/O management is slow. Error handling can present bottleneck issues that bring application responsiveness to a crawl.
Some common application-level bottlenecks are known as CPU Utilization, Memory Utilization, Network Utilization, Software Limitation, and Disk Utilization. There are appropriate metrics or KPI’s that help to determine when the application is the bottleneck. An application bottleneck occurs when the capacity of an application is limited by a single component. An inadequate CPU memory size can become a bottleneck if the application memory requirement is 2 GB, and the computer or server memory allocation is 2GB. The operating system requires so much memory allocation let’s say 1 GB. This creates a bottleneck due to the conflicting needs.
Resolving the bottlenecks or troubleshooting them requires monitoring tools. For instance, a memory bottleneck does not always mean just add more memory. With the right tool we can see the memory impact, but we can also drill down to method level in a program to see where it takes an action that consumes memory but does not release it. That is usually a memory leak condition. This can lead to an overuse of memory. It should mean the application needs debugging. It could mean simply to add appropriate memory release code. So, bottleneck resolution offers a practical way to enable performance analysts to review the current process, and then identify and implement opportunities for improvement.
DB Bottleneck Area
Error handling is a useful segue into database management bottleneck potentials. Though it is only one of many possible issues in the database performance area. Yet it can be an unpleasant impact to the other requirements for data management. Because of error handling, a database management system can be too busy inserting and updating notification data.
I remember on a particular application where it was recording at least two status messages for each user request – one to a log file and another to a database audit table. This may not seem like an issue. But when your application supports inquiry and reporting requests along with insert, update, and delete requests the number of audit records can be too much. It’s worth investigating to determine if logging is better than DB writes. It is also worth determining if inquiry and reporting requests add value. Anyway there is an opportunity for improvement to reduce bottleneck potential.
The most common database management systems like Oracle, MySQL, and MS SQL Server come loaded with diagnostic tools to verify and tune the system. However, they must be configured to set alerts and send notifications. Then the conditions reported must be interpreted to determine what actions to take to improve data management performance.
Closing Remarks
The same way I might look at eliminating Network as a bottleneck, one can look at the Web and DB areas. I may be able to eliminate additional bottleneck areas or at least part of Web and DB areas. You might ask why they may not be a bottleneck candidate. The staff supporting the web and database environments are professionals. They do performance analysis in their respective areas. Therefore, the areas may already be well tuned.
I take the same approach with them as I do with network engineers. Web Server technicians and Database Server technicians or DB Analysts should be engaged as experts or Subject Matter Experts (SME’s). They know their environment and can be valuable in determining how to confirm bottleneck concerns. They need to be included as part of the performance testing team. When potential bottlenecks are raised, they need to be utilized for addressing issues that are presented as observations and recommendations. There may be some finger pointing before the smoke clears, but the discussions that ensue can lead to the right conclusions.