
Introduction
Cloud-based Application Testing
When you begin your Salesforce implementation, you expect
responsive functionality. You expect data queries, data loads, data updates to respond instantly. Page loads should be less than two seconds. And other activities should be less than 5 seconds. The only functionality that may be allowed higher than 5 seconds are report requests.
But at some point, you need to increase the growth of your system. That can mean increased user traffic, growing data volumes, or increase in transactions per second to support your growing customer base. This article addresses the Salesforce challenge using JMeter to conduct performance tests. More specifically how to use JMeter to test Salesforce GUI functions.
Since Salesforce is a cloud-based application managed by its
vendor, much of the performance issues are charged to the vendor. The reason is that all Salesforce customers share its services like tenants in an apartment building. The database services, application and security services are shared. This
means the customers should only be directly concerned with the application customization performance. But even that is in the shared environment which impacts other Salesforce customers.
Salesforce Application Testing
When you make changes or customize your implementation of
Salesforce as a customer, consider the following information at the Salesforce Help site. You should read the following:
- Methods of Locating and Testing for Performance Issues Measure
- Performance for Your Salesforce Org Develop
- Your Performance Testing Strategy.
Strategic Summary
Your business use of Salesforce enables you to access and manipulate data on somebody else’s computer site. Your data is securely stored and processed on the Salesforce vendor site. You interact with the data via a browser window through a specific and unique URL. The vendor ensures you that the core system and its functions operate within normal parameters. They also monitor the system to make performance adjustments when required.
If you encounter performance issues, they are available to
respond. However, you may desire to conduct performance tests to examine issues of your own, but you must gain approval from the vendor and conduct tests within their guidelines.
Normally my approach to performance testing of an application is to look for bottlenecks. So, I test with five areas of bottlenecks in mind. The five areas of bottlenecks are Client machine issues, network issues, web service issues, application service issues, and database issues. With Salesforce, the first two areas of potential bottlenecks are important to a Salesforce customer. What remains is handled by the Salesforce vendor. Therefore, you as the customer should be focused on the front-end processing, such as, page load time and network latency. You could have client machine issues or network-related issues. If you have a good network engineering staff, then what remains is the client machines in use in your organization.
Customer performance testing of Salesforce applications
should primarily be focused on the time a page is received on a client machine and rendered in a browser. Customer users may periodically complain that their computers are responding slower than usual for a Salesforce business create, update, delete, or query function. Some research is necessary at the customer
site to determine if the bottleneck is a computer-related issue or
network-related issue. Otherwise, the issue should be forwarded to the Salesforce vendor for resolution.
Once a Salesforce customer determines a need to measure performance, performance monitoring should be the first level of action. Determine in the Salesforce production system if network latency or client machine processing is on the increase. If you cannot pinpoint where the performance degradation is, then the Salesforce vendor must still be involved. They can approve of you conducting performance tests in the Salesforce sandbox environment, or they can disapprove. Customer performance testing must be done in a way that it does not impact other
Salesforce customer traffic on the vendor servers in the Salesforce cloud. So, you cannot suddenly decide to impose high levels of traffic on your Salesforce application. It must be planned with the vendor.
The strategy for measuring and analyzing Salesforce
performance at a customer site is two-fold. Performance Monitoring should be implemented during the development unit test and post-production stages. Through repetition a proactive strategy is in place to detect if performance is degrading or improving. Performance testing is a strategy that can be implemented in pre-production as part of regression testing to ensure no unexpected performance degradation is promoted to production. The focus should primarily be on object or process Salesforce customization.
Please note that there is a phase in Agile called Sprint Hardening. This phase should not only require full business functional testing but would require a full load test targeting all business functions. A business function that did not require changes during the current sprint must not be excluded. Performance regression is possible just like functional regression.
Performance Monitoring & Testing Using Automation Tools
There are many application performance monitoring tools on
the market that are useful. But favorites are New Relic, SiteScope, Prometheus, AppDynamics, and Dynatrace. And there are several application performance test tools available, such as, LoadRunner, JMeter, and IBM Rational. However, I am
going to focus a significant part of this article on using JMeter for testing and monitoring.
It is important to know what to measure. In other words,
what KPIs or Key Performance Indicators should be identified and monitored during monitoring and testing Salesforce applications?
Performance testing and monitoring is about measuring. The
Salesforce Applications are built upon web technologies and are accessible via internet browsers. You might be tempted to use metrics or KPIs that are common to web application testing, such as page response time and time to first byte. That may help you, but you should use metrics that consider the Salesforce
architecture.
When you measure user experience in Salesforce, the measurement or KPI should be something called Experienced Page Time (EPT).
EPT is designed to consider Salesforce Lightning pages.
Lightning pages can communicate with the Salesforce backend. Network chattiness can create a disconnect between a page before it is fully rendered. EPT measures when the page is rendered.
To view more details about how to view EPT in the browser
with the Lightning Usage App and Event Monitoring, see the Measure Performance for Your Salesforce Org document.
There are also Server-side metrics to consider even though
they are normally monitored by Salesforce vendor staff.
We can look at EPT easily because it is measured from the
client’s perspective. The Salesforce vendor hosts a vigorous infrastructure. You can gain insight into how Salesforce is performing on the server side during a test run with what is called Shield Event Monitoring.
There are many metrics/KPIs that are enabled with Shield Event
Monitoring. Go to this link on Event Monitoring to get more detail. Some examples follow:
- RUN_TIME: What was the total amount of time for
the transaction? - CPU_TIME: How much time is spent in the
application tier? - DB_CPU_TIME: How much time is spent in the
database tier? - DB_TOTAL_TIME: How much time does it take to
make a database call?
Event Monitoring is a tool that Salesforce provides to help
keep your data secure. You can see the granular details that your users perform. These user activities are events. You can view information about individual events or track event trends to identify abnormal behavior and protect your company’s data.
Here are some events available for performance tracking
which include:
- Login and log out
- URI (web clicks)
- Visualforce page loads
- API calls
- Apex executions
- Report exports
JMeter Script Development for Salesforce
One of the first concepts I teach when creating scripts is
to be familiar with the target application. Normal web applications include authentication processing from a home page, menu processing, data manipulation, querying, and log out. Salesforce is similar but more object oriented. Return of data can be more than what appears on a screen which can mean more data transmission but less round trips to get data for rendering on a screen.
Back to application familiarity. Building Salesforce scripts
should be divided into application connectivity, authentication processing, home page rendering, business process selection, object selection, and then object manipulation processing. Scripts should be designed to handle one or more selection and manipulation processes.
When you engage your Salesforce application edition, you are
expected to supply an assigned URL, user account, password and maybe a token or two. The credentials supplied are based on the method used to launch Salesforce. For instance, if you are launching Salesforce from a browser, it may require only the URL, user account and password. But if you are using a testing tool to launch Salesforce, then it will require a token to pass OAuth authentication.
Authentication is an important part of the script development process. I like to couple authentication or Salesforce launching
with the log out process. This creates a script that ensures you have the right code for launching and shutdown of Salesforce. Every new script has a starting point in development. From there the business and manipulation processes become the unique part of development.
Recording
JMeter scripts can be developed using a known sequence of
HTTP requests that emulate the URL sequence necessary to connect, login, select an object, edit an object record, and then log out. But it also has a recording method that can be used to capture Salesforce resources behind the scenes. This may be easier than writing your own HTTP requests. Although you can do that, you must be aware of some hidden cookies and tokens. If you have time, you can also explore the BlazeMeter script record approach for Chrome browser use only. I am not going to get into details about this approach here.
However, I must add an insert here. After several weeks of
lost time, I discovered some challenges with recording a Salesforce test script using the Chrome browser. I have found over several years that recording scripts using Chrome with different test tools was a preferred method. But after several weeks of challenges trying to get a Salesforce Login and Logout
script to work successfully, I have switched to Firefox. Without going into a long discussion on what went wrong, let me just say that during the recording process Firefox identified most of the cookies and tokens that were necessary for successful script playback. With a little correlation time, (about 1 hour) I had the script to connect, login, and logout successfully within two hours
total time. I was impressed. And while I am on a caveat regarding browser recording. Let me give you another.
This caveat is regarding the accuracy of your recorded script
with JMeter and your browser. Depending on the browser you choose to accomplish the recording process, and your choice to exclude certain embedded downloads like JavaScript, CSS, and etcetera. You may be ignoring some processing time that affects what you analyze and report to your stakeholders. As a performance tester with Salesforce applications, you should be able in some way to identify if component downloads to client machines are efficient.
The point I am making can be addressed either by allowing
the downloaded components to be included in the test scripts, or capture browser network performance data to analyze. You should report how well the status of component downloading is happening. And also, you should be able to point out when the components are impacting screen render time.
JMeter Recording Setup
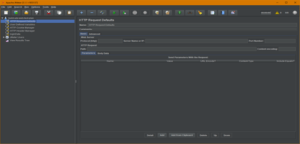
JMeter has a helpful feature that should be used to create a
new Salesforce script. The feature is known as Test Plan templates. In the JMeter IDE (figure 1), you can select Templates from the FILE pulldown menu and select an appropriate template for web script development. I choose the advanced web test plan template which generates the elements you see in figure 1.
Figure 1
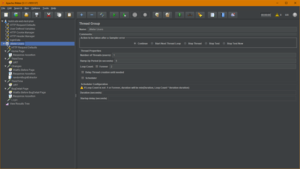
If you expand the element list (OPTIONS>Expand All), you
will see all the elements generated as in figure 2. I have lessons in a free JMeter course on YouTube that you can find on my website. So, I won’t go into detail on all the elements.
Figure 2
From here you can modify the script elements to redefine the
test plan for Salesforce processing. There are several HTTP requests that can be redefined to Connect, Login, and Log out of Salesforce. There are elements to manage a file used to input login credentials. There are elements to manage responses to verify that Salesforce is engaged for the home page, login and log out.
JMeter Recording
I mentioned earlier in this article that I recommend using
Firefox at the present time to record a script for testing Salesforce. It makes the recording job much easier. With the advanced test plan, you can remove the generated HTTP request elements, and add recording elements and Listener
elements. I use the User Defined Definition element to define the host variable with the name of the target Salesforce edition to test. In my JMeter class or other classes available online you can learn about setup requirements before recording a script. The Recording Controller and HTTP(S) Test Script Recorder
elements are important to the recording action in JMeter. But I will refrain from going into the details of it here. If you need the knowledge don’t hesitate to use my class videos.
Start with recording only the connect, login, and logout
Salesforce processes. First, it provides foundational knowledge of the HTTP requests needed along with parameterization requirements. This way you are not overwhelmed. Second, it is enough elements created to define a beginning structure.
The Controller elements can help with dividing the connect, login, and logout elements into groups inside the thread group. Third, you can even setup the groups as test fragments in JMeter. They can become a template for subsequent script development. This gives you flexibility in script development going forward.
JMeter Post Recording
The categories I associate to the activities after recording
JMeter scripts are like all web applications – not just Salesforce. Allow me to define the categories this way:
- Group for aggregation
- Test for correlation needs
- Build scripts for application functionality
- Build scenario scripts for performance testing
- Define internal and external reporting
requirements - Analyze test results
- Report on findings
Group for aggregation
I use the Simple Controller if the JMeter elements just need
to be grouped together and collapsed. But I use the Transaction Controller to
group multiple elements that will result in an aggregate total that gets shown
on a report in summary format.
Test for correlation needs
Every script that is developed must be tested. But add to
the testing the need to correlate. What I mean is that there are usually – not always, but usually some data is dynamic passed from one HTTP request to another. This data is known as tokens, cookies, or hidden data stored in HTTP headers and
response bodies. Often the values are set at the beginning of a dialog with an application, such as, in the login request. While other times the values change from one HTTP request to another. The purpose of being dynamic is primarily to
provide application security.
No matter what the reasons are behind dynamic data, the
first few rounds of testing should be focused on correlation. The concept involves identifying what request has the source data value, use a post processor element in JMeter to capture the value, assign a variable name to it, and then override subsequent references to the value with the variable name.
You should notice that HTTP response data will have valid data and good response codes.
Build scripts for application functionality
Consider the script development in terms first for testing
individual functions. Consider it very useful for running single-user testing where you can obtain some baseline performance information. These scripts can be added to a test automation system especially in an Agile environment where there is a job pipeline, such as, Jenkins.
Build scenario scripts for performance testing
At some point the JMeter scripts should evolve into what I
call Scenario scripts. Scenario scripts describe an action a user may undertake with a website or application. This can be as simple as the connect, login, and then logout. But it can include multiple business actions that a user might step through before logging out of the application. When a performance test is
defined usually one or more scenarios are scheduled.
In JMeter its design can be utilized to run each script
separately, from multiple computers executing different scripts concurrently, or as one large script executing one or more scenarios to achieve the traffic or load desired.
Define internal and external reporting requirements
In JMeter various reports can be selected to provide useful
output while you test both for single users and multiple concurrent users. Though it is not recommended you do all your load and stress testing in the GUI mode of JMeter. It is a good starting point. Once you see that the output is valuable or you want to increase the intensity of the testing, external
reporting is the direction to take. This can mean the external reports JMeter provides called Dashboard Reporting. Or it may mean to use Application Performance Monitoring tools that run at the same time the performance tests run. Then you manually review the monitor results during the time the tests were running. The combination should provide good data results for analysis.
Analyze test results
JMeter does provide plugins to help with integrating with
other tools that support application performance monitoring data. The output is typically in a uniform format that lends itself to easy analyzing no matter what the APM tool is in use. This activity is highly dependent on the individuals performance test experiences.
Report on findings
On the eve of good analytical discoveries, reporting is the
final step to completing at least the first round of updating your
stakeholders. I say it this way because this could be an iterative process if you are in Agile sprint cycles. You may also be headed into one or more tuning cycles if you recommended follow-up activities to improve the application performance. Your findings may require proving application or database setting changes, or even network optimization changes.
I like to think of the findings report to be documented in a
way that describes observations, recommendations, and conclusions. Observations might be findings that need more attention before coming to a recommendation or drawing a conclusion. Recommendations might be findings that suggest changes to settings to improve performance. Follow-up testing should confirm the improvement. Conclusions are findings that there is certainty in addressing a follow-up activity that will result in performance improvement. This level of finding may be changes that are applied to the network or some other software
not integral to your application. Could be the middleware or operating system software or something else running on the network.
Closeout
This article is not intended to be published alone. I will
have an accompanying video tutorial available on the internet. It will demonstrate what I have been sharing. Regretfully I started out with the intent of showing you how to develop a JMeter Salesforce test script using the Chrome browser. Instead, I am resorting to my old faithful browser – Firefox. You should expect that newer releases of browsers and Salesforce will change the
dynamics again. I encourage you to see the video demonstration.
In the future I do plan to write subsequent articles related
to this topic. It should be helpful to articulate on what it takes to write a JMeter script that navigates through the Salesforce home page doing some business functions. Then I believe it would be helpful to demonstrate my take on Salesforce API performance testing. Please use the Comments section below to give me some additional ideas about what related topics would be helpful to you.
Wrap-up
JMeter is one of the tools useful to testing Salesforce. There
are others that meet performance testing requirements for Salesforce applications. I will address other solutions in other articles. However, it is important to follow Salesforce guidelines regarding performance testing Salesforce applications. Avoid conducting tests that impose high traffic or stressful traffic on the application without first contacting the vendor. The design of the application supports community sharing of resources. Salesforce is cloud-based and thus shares its resources among its customers. You are not alone with your application.
I recommend sign-up on the Salesforce Trailhead site to
assist you with becoming comfortable using your Salesforce environment. This site is intended to support you with questions you have, Salesforce knowledge, certification preparation, and track your progress with Salesforce learning topics. There is a similar site called the Salesforce Help. The Salesforce help
site is a portal you can log cases, find clear documentation, explore known issues, and get quick access to Trailhead and the Trailblazer Community. The combination of the two sites is powerful for building Salesforce soft and technical skills.