
Introduction
Cloud-based Application Testing
Salesforce implementation is in the cloud. It is a web application but is not installed at a customer site. The vendor manages web, application, and database services for Salesforce. But you still expect responsive functionality. You expect data queries, data loads, data updates to respond instantly. Page loads should be less than two seconds. And other activities should be less than 5 seconds. The only functionality that may be allowed higher than 5 seconds are report requests.
And then at some point, you need to increase the growth of your system. That can mean increased user traffic, growing data volumes, or increase in transactions per second to support your growing customer base. This article addresses the Salesforce challenge using LoadRunner VuGEN to conduct performance tests.
Since Salesforce is a cloud-based application managed by its vendor, much of the performance issues are charged to the vendor. The reason is that all Salesforce customers share its services like tenants in an apartment building. The database services, application and security services are shared. This means the customers should only be directly concerned with the application customization performance. But even that is in the shared environment which impacts other Salesforce customers.
Salesforce Application Testing
When you make changes or customize your implementation of Salesforce as a customer, consider the following information at the Salesforce Help site. You should read the following:
- Methods of Locating and Testing for Performance Issues,
- Measure Performance for Your Salesforce Org,
- Develop Your Performance Testing Strategy.
Strategic Summary
Your business use of Salesforce enables you to access and manipulate data on somebody else’s computer site. Your data is securely stored and processed on the Salesforce vendor site. You interact with the data via a browser window through a specific and unique URL. The vendor ensures you that the core system and its functions operate within normal parameters. They also monitor the system to make performance adjustments when required.
If you encounter performance issues, they are available to respond. However, you may desire to conduct performance tests to examine issues of your own, but you must gain approval from the vendor and conduct tests within their guidelines.
Normally my approach to performance testing of an application is to look for bottlenecks. So, I test with five areas of potential bottlenecks in mind. The five areas of bottlenecks are Client machine issues, network issues, web service issues, application service issues, and database issues. With Salesforce, the first two areas of potential bottlenecks are important to a Salesforce customer. What remains is handled by the Salesforce vendor. Therefore, you as the customer should be focused on page load time and network latency. You could have client machine issues or network-related issues. If you have a good network engineer staff, then what remains is the client machines in use in your organization. Where are they located? Are they in the same place or different geographic areas? The traffic routing to and from the endpoints can encounter unwanted bottlenecks.
Customer performance testing of Salesforce applications should primarily be focused on the time a page is received on a client machine and rendered in a browser. Customer users may periodically complain that their computers are responding slower than usual for a Salesforce business create, update, delete, or query function. Some research is necessary at the customer site to determine if the bottleneck is a computer-related issue or network-related issue. Otherwise, the issue should be forwarded to the Salesforce vendor for resolution.
Once a Salesforce customer determines a need to measure performance, performance monitoring should be the first level of action. Determine in the Salesforce production system if network latency or client machine processing is on the increase. If you cannot pinpoint where the performance degradation is, then the Salesforce vendor must still be involved. They can approve of you conducting performance tests in the Salesforce sandbox environment, or they can disapprove. Customer performance testing must be done in a way that it does not impact other Salesforce customer traffic on the vendor servers in the Salesforce cloud. Working with the vendor you may find days and times when the traffic is amenable to your test traffic needs.
The strategy for measuring and analyzing Salesforce performance at a customer site is two-fold. Performance Monitoring should be implemented during the development unit test and postproduction stages. Through repetition a proactive strategy is in place to detect if performance is degrading or improving. Performance testing is a strategy that can be implemented in preproduction as part of regression testing to ensure no unexpected performance degradation is promoted to production. The focus should primarily be on object or process Salesforce customization.
Please note that there is a phase in Agile called Spring Hardening. This phase should not only require full business functional testing but would require a full load test targeting all business functions. A business function that did not require changes during the current sprint must not be excluded. Performance regression is possible just like functional regression.
Performance Monitoring & Testing Using Automation Tools
There are many application performance monitoring tools on the market that are useful. But favorites are New Relic, SiteScope, Prometheus, AppDynamics, and Dynatrace. And there are several performance test automation tools available, such as, LoadRunner, JMeter, and IBM Rational. However, I am going to focus a significant part of this article on using the LoadRunner TruClient tool for testing and monitoring.
It is important to know what to measure. In other words, what KPIs or Key Performance Indicators should be identified and monitored during monitoring and testing Salesforce applications?
Performance testing and monitoring is about measuring. The Salesforce Applications are built upon web technologies and are accessible via internet browsers. You might be tempted to use metrics or KPIs that are common to web application testing, such as page response time and time to first byte. That may help you, but you should use metrics that consider the Salesforce architecture.
When you measure user experience in Salesforce, the measurement or KPI should be something called Experienced Page Time (EPT).
EPT is designed to consider Salesforce Lightning pages. Lightning pages can communicate with the Salesforce backend. Network chattiness can create a disconnect between a page before it is fully rendered. EPT measures when the page is rendered.
More details about how to view EPT in the browser with the Lightning Usage App and Event Monitoring, see the Measure Performance for Your Salesforce Org document.
There are also Server-side metrics to consider even though they are normally monitored by Salesforce vendor staff.
We, as Salesforce customers, can look at EPT easily because it is measured from the client’s perspective. The Salesforce vendor hosts a vigorous infrastructure. You can gain insight into how Salesforce is performing on the server side during a test run with what is called Shield Event Monitoring.
There are many metrics/KPIs that are enabled with Shield Event Monitoring. Go to this link on Event Monitoring to get more detail. Some examples follow:
- RUN_TIME: What was the total amount of time for the transaction?
- CPU_TIME: How much time is spent in the application tier?
- DB_CPU_TIME: How much time is spent in the database tier?
- DB_TOTAL_TIME: How much time does it take to make a database call?
Event Monitoring is a tool that Salesforce provides to help keep your data secure. You can see the granular details that your users perform. These user activities are events. You can view information about individual events or track event trends identify abnormal behavior and protect your company’s data.
Here are some events available for tracking which include:
- Login and log out
- URI (web clicks)
- Visualforce page loads
- API calls
- Apex executions
- Report exports
VuGEN Script Development for Salesforce
One of the first concepts I teach when creating scripts is to be familiar with the target application. Normal web applications include authentication processing from a home page, menu processing, data manipulation, querying, and log out. Salesforce is similar but more object oriented. Return of data can be more than what appears on a screen which can mean more data transmission but less round trips to get data for rendering on a screen.
Back to application familiarity. Building Salesforce scripts should be divided into application connectivity, authentication processing, home page rendering, business process selection, object selection, and then object manipulation processing. Scripts should be designed to handle one or more selection and manipulation processes.
When you engage your Salesforce application edition, you are expected to supply an assigned URL, user account, password and maybe a token. The credentials supplied are based on the method used to launch Salesforce. For instance, if you are launching Salesforce from a browser, it may require only the URL, user account and password. But if you are using a testing tool to launch Salesforce API’s, then it will require a token to pass OAuth authentication.
Authentication is an important part of the script development process. I like to couple authentication or Salesforce launching with the log out process. This creates a script that ensures you have the right code for launching and shutdown of Salesforce. Every new script has a starting point in development. From there the business and manipulation processes become the unique part of development.
Recording
VuGEN scripts can be developed using HTTP requests that emulate the URL sequence necessary to connect, login, select an object, edit an object record, and then log out. But it also has a recording method that can be used to capture Salesforce resources behind the scenes. These “behind-the-scene” resources are cookies, header data, and other dynamic data that must pass values to subsequent events. In VuGEN scripts they might be known as WEB_ADD_COOKIES, WEB_ADD_HEADERS, and correlation data in WEB_REG_SAVE_PARAM_REGEXP data parameters.
For example, a cookie value that must pass from the Salesforce connect request to the login process is a cookie labelled with the name QCQQ. Its purpose is not important, but its value is important for processing success.
The size of the script I demo in the associated video tutorial is more than 1200 statements. Therefore, it is not prudent to display the script statements here. But there is a video (see here) intended to provide the demonstration of the script discussed in this article. As an alternative I can show you (figure 1) a summary view of the start and end statements that result from the script execution output. The pairs of statements provide information describing actions, timing, and data transmission statistics.
Figure 1
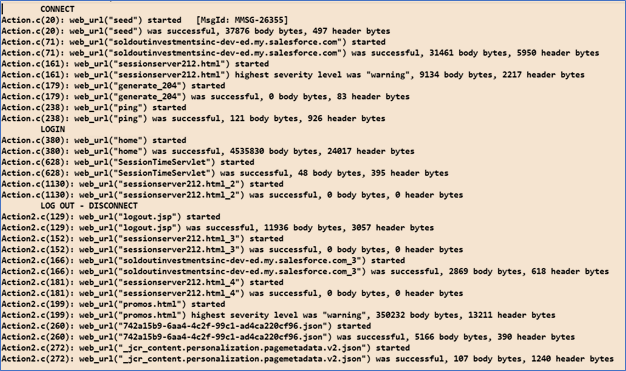
I manually separated the statements into sections to denote transaction processing. Hopefully it describes clearly what are the connection, login, and log out activities.
VuGEN Post Recording
In the associated video tutorial you can see what LoadRunner VuGEN looks like after record and playback. Steps are recorded to process Salesforce connect, login, and log out. From here business transactions in Salesforce can be recorded and inserted between the login and log out transactions.
This record and playback approach is a good way to verify that VuGEN is setup properly to record interaction with the target Salesforce application.
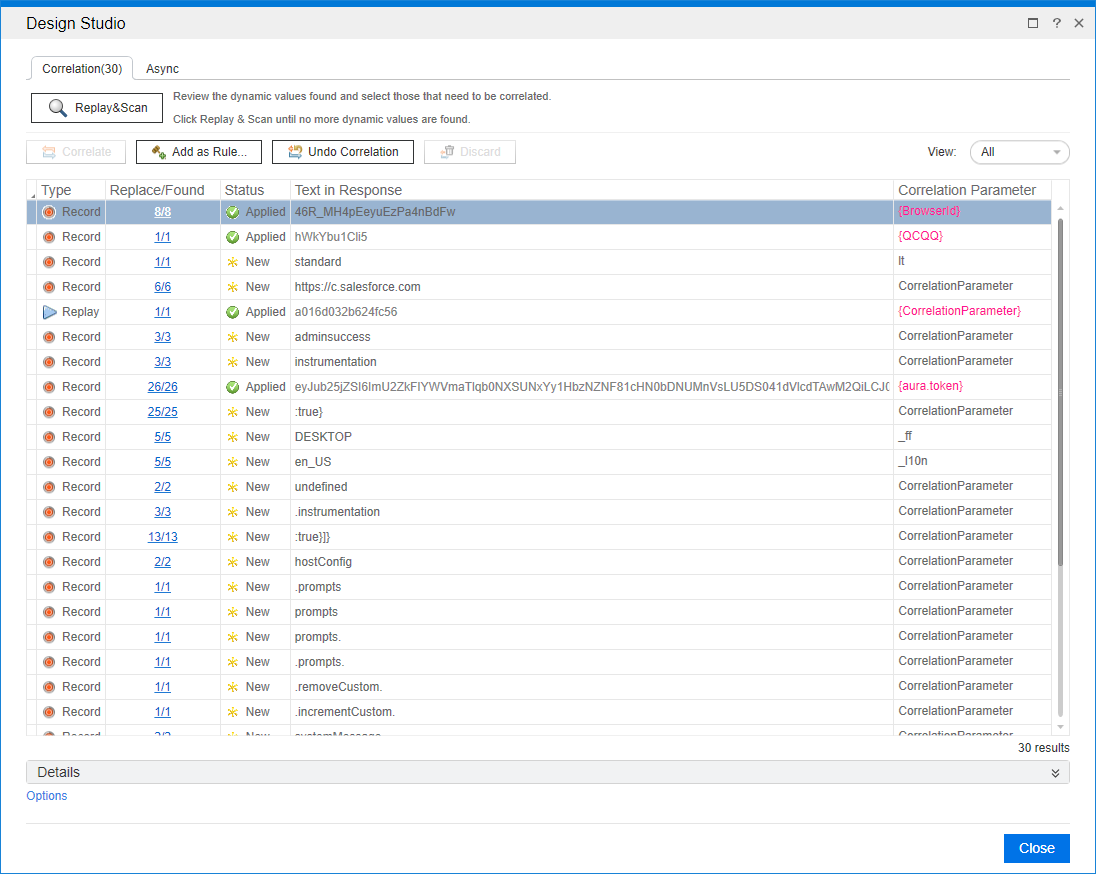
I had no direct editing required but VuGEN correlation was necessary. Only 4 items of many needed to be correlated. See the details in figure 2. The four items with a status of APPLIED represent the correlated variables. All the other items could be correlated if there is certainty that they will change during subsequent test iterations. Otherwise, there is no need to correlate. VuGEBN does a good job of scanning the recorded and replay data to identify dynamic data in the header and body of transmitted parameters. It truly is a time saver feature.
Figure 2
To create VuGEN scripts you always start with launching LoadRunner VuGEN. Then there is a display for protocols. You will see a list of which there are several web options. I used the HTTP web protocol option for developing a script for testing Salesforce.
VuGEN Test Results
In a previous display you saw a summary of the detail results. But on the detail report there is a button on the display that is labelled “View Summary”. Pressing that button provides you with a summary display as seen in figure 3. That summary includes a link for another report. The report is entitled “Open NV Insights Report”.
Figure 3
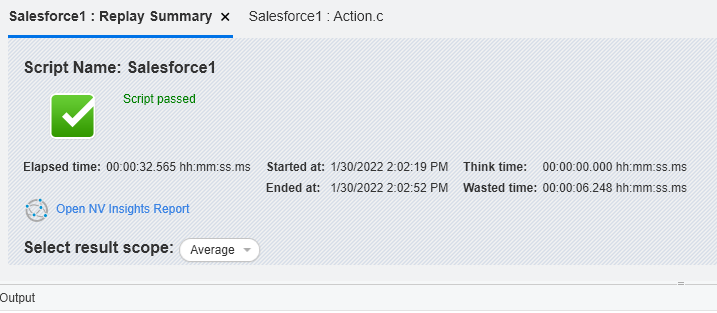
The “Open NV Insights Report” is a very useful report. It provides reporting like the Chrome browser Lighthouse feature and LoadRunner’s analysis report showing First to buffer information. You can read more about installing and setting up LoadRunner’s Network Virtualization tool.
VuGEN Open NV Insights Report
The default initial display of the report is seen in figure 4. Figure 5 display a sample of the drill-down reports in NV. The Insights report for VuGEN starts with a general report showing Transaction Passed/Failed status and Network impact data. The right panel describes overview reporting of transaction elapsed time, throughput, and completion grades. More detail reporting can be drilled down to by clicking on the respective transaction name.
The key displays then are
- An overall average grade indicating the status of the analysis showing a grade A-F
- 2 timing indicating time spent in the network and overall duration
- The left panel below the timing are buttons to display 7 other reports
- The default report is the Recommendations report which is one of the 7
- This report displays events assessed with the grades A-F
I did not mention it before. The sample script is divided into two Action scripts – Action and Action2. Action is the VuGEN code for processing Salesforce connect and login. Action2 is the code for Salesforce log out. I had intended to separate the code for all three actions. Instead, I left the connect process with login.
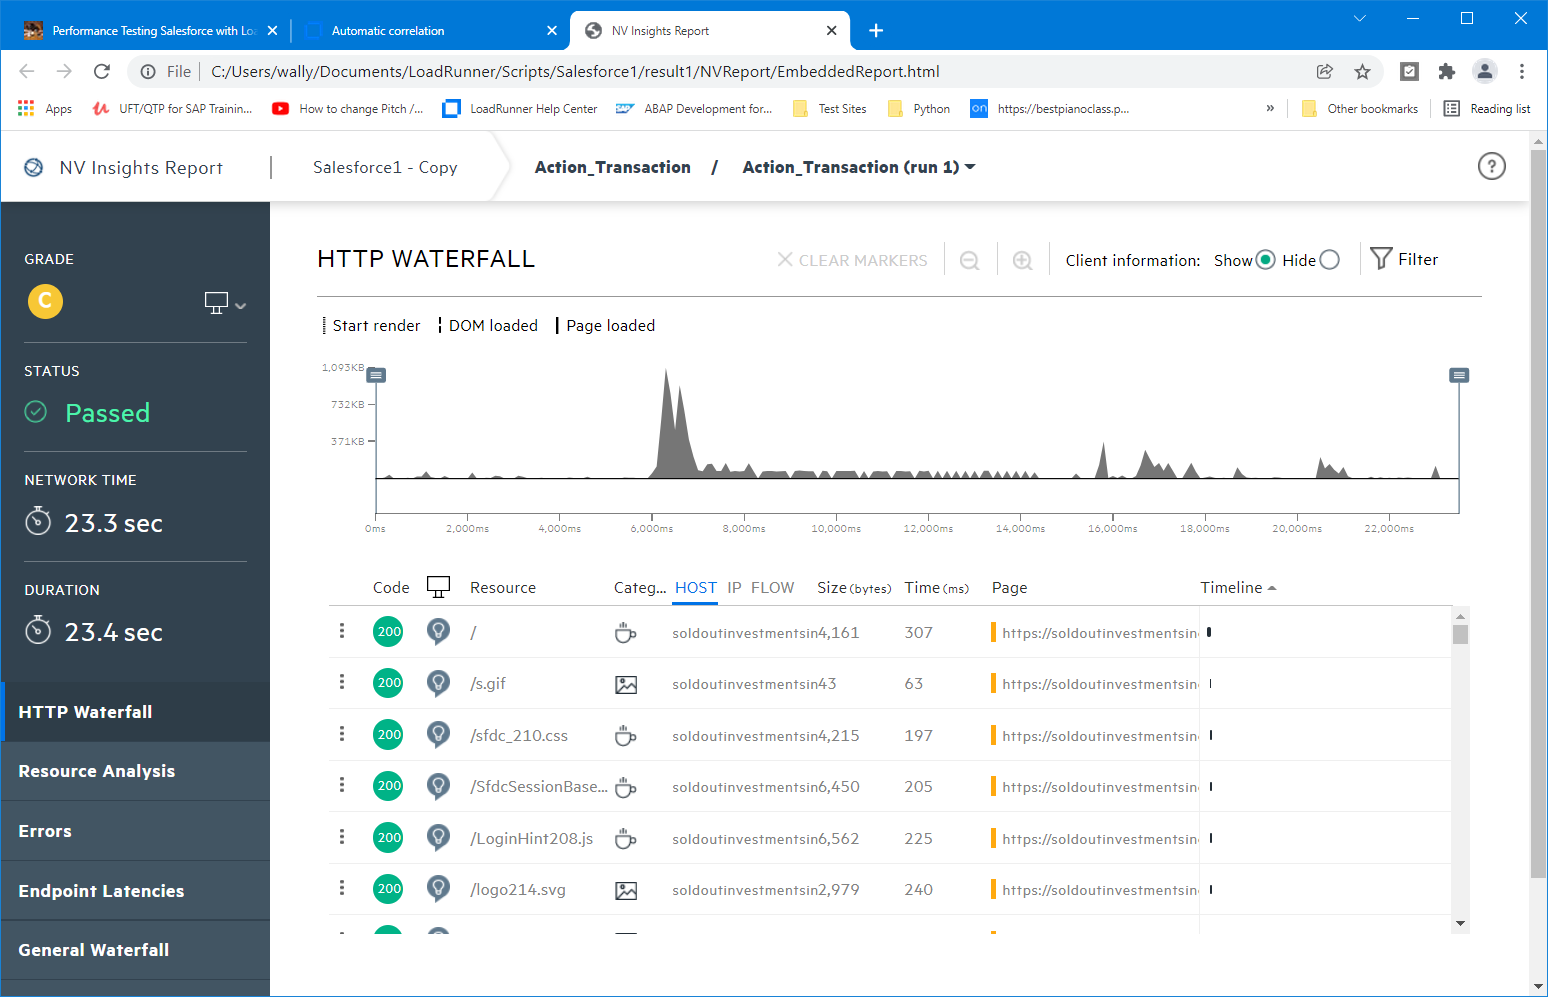
In performance projects I have conducted my reporting approach divides the output into three categories: Observations, Recommendations, and Conclusions. When performance testing for Salesforce the two primary areas of potential bottlenecks for the customer are the client rendering and network traffic performance. The NV Insights reporting assist with those areas with the following reports:
- HTTP Waterfall – graphic report concerning screen rendering
- Resource Analysis – graphic reports concerned with page component sizes
- Errors report – HTTP code and TCP timeout data
- Endpoint Latencies – time reporting between IP addresses
- General Waterfall – protocol time reporting between IP addresses
- Summaries – time spent connecting to salesforce, rendering on the client, transmitting data, and waiting on responses
- Recommendations – this detail provides technical actions to take for response time improvements
Figure 4
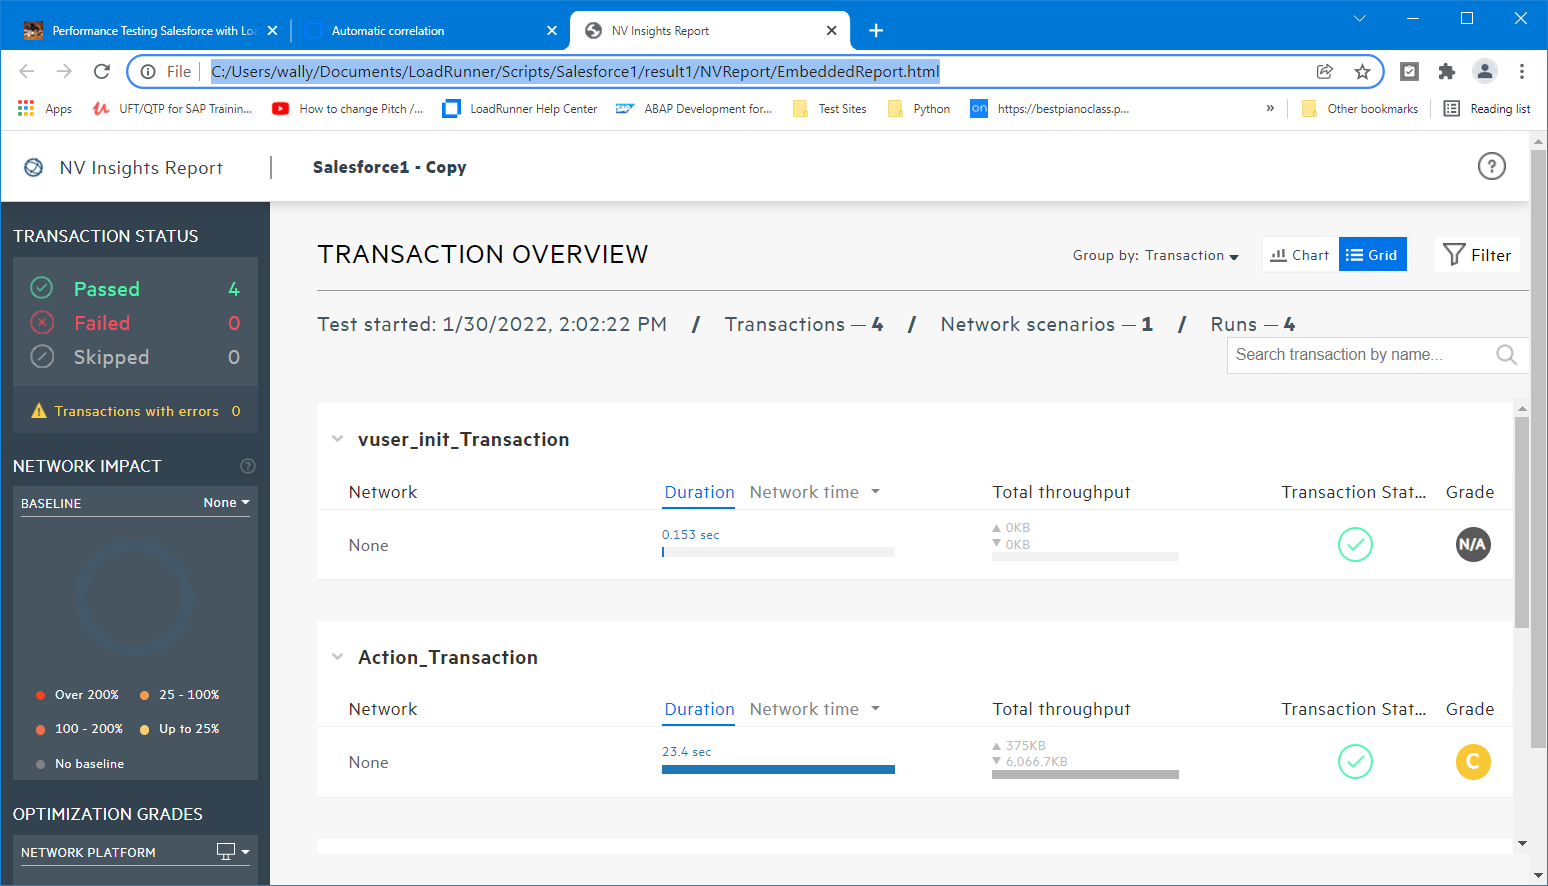
Figure 5
Wrap-up
VuGEN is one of the LoadRunner tools useful to testing Salesforce. There are others that meet performance testing requirements for Salesforce applications. I will address other solutions in other articles. However, it is important to follow Salesforce guidelines regarding performance testing Salesforce applications. Avoid conducting tests that impose high traffic or stressful traffic on the application without first contacting the vendor. The design of the application supports community sharing of resources. Salesforce is cloud-based and thus shares its resources among its customers. You are not alone with your application.
I recommend sign-up on the Salesforce Trailhead site to assist you with becoming comfortable using your Salesforce environment. This site is intended to support you with questions you have, Salesforce knowledge, certification preparation, and track your progress with Salesforce learning topics. There is a similar site called the Salesforce Help. The Salesforce help site is a portal you can log cases, find clear documentation, explore known issues, and get quick access to Trailhead and the Trailblazer Community.
The combination of the two sites is powerful for building Salesforce soft and technical skills.